Agent Observability in 2026: Tracing, Replay, and Why OTel Won
Three things happened to the agent observability landscape in the first four months of 2026, and you can read the whole reshuffle as a single coherent story.
In January, ClickHouse acquired Langfuse as part of their $400M Series D. In March, Helicone’s founders joined Mintlify and put Helicone in maintenance mode. In late March, OpenTelemetry published the GenAI Semantic Conventions — a real, ratified standard for how LLM spans should be named, attributed, and structured.
Those three events are causally connected. OpenTelemetry standardization moved the substrate. Vendors built on top of OTel (Langfuse, Phoenix) got more valuable; vendors that predated it (Helicone, with its proxy-based architecture) got harder to maintain. The acquisition and the maintenance-mode announcement are both signals of the same underlying shift.
This post is about what observability looks like for production agents after that shift settled.
The OTel GenAI conventions, briefly
If you skipped the spec, the short version: OpenTelemetry now defines how to name spans, what attributes a tool call should have, how to log prompts without leaking PII, and which span kind to use for an agent. The spec is experimental, but the major vendors are committing to it.
The key span kinds:
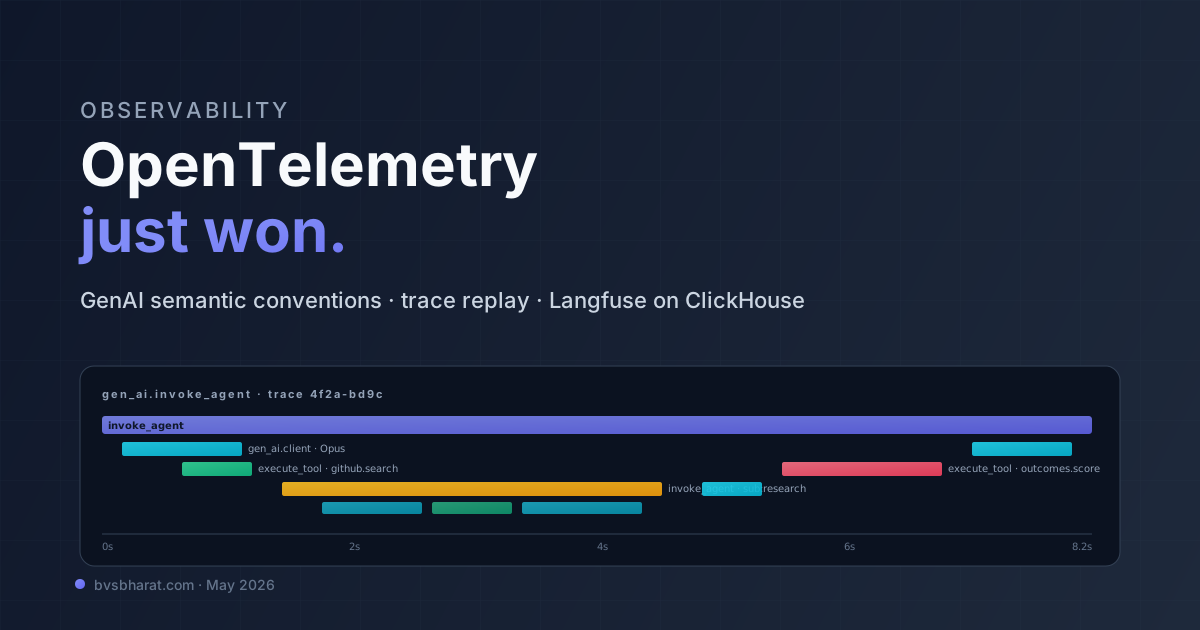
gen_ai.client— an LLM API callgen_ai.execute_tool— a tool/function invocation by an agentgen_ai.create_agent— the start of an agent sessiongen_ai.invoke_agent— a turn of an agent’s loop
Attributes are namespaced under gen_ai.* (model name, prompt template, token counts) and gen_ai.tool.* (tool name, input args, output). PII handling is explicit — there’s a gen_ai.prompt.redact attribute for fields that contain user data the platform shouldn’t index.
The practical implication: an agent instrumented to OTel GenAI conventions can be observed by any platform that consumes OTel. The lock-in goes away. Switching from Langfuse to Phoenix becomes a config change, not a re-instrumentation. This is the same dynamic that played out with metrics and logs in the 2010s — once the standard exists, the value moves from instrumentation to analysis.
The 2026 vendor landscape
Stack-rank of the observability platforms I’ve seen in production, post-shift:
| Platform | Status | Best for |
|---|---|---|
| Langfuse | Acquired by ClickHouse, full-speed | Default open-source observability; ClickHouse-backed analytics at scale |
| Phoenix (Arize) | Strongest OTel-native story | Self-hosted, regulated industries, teams already on OTel |
| Weave (W&B / CoreWeave) | Premium agent trace observability | Multi-framework MCP auto-logging is unique; pricier |
| Braintrust | Eval-first with tracing attached | Teams who want eval + tracing in one platform |
| LangSmith | LangChain-native; OTel ingestion added | LangChain stack; less compelling elsewhere |
| Helicone | Maintenance mode | Existing users; new deployments should look elsewhere |
| Logfire (Pydantic) | Pydantic-aware, OTel-native | Python-heavy teams with structured-output emphasis |
If I’m starting fresh in May 2026: Langfuse for the default open-source-with-paid-cloud option, Phoenix for the “I’m running this self-hosted on my OTel collector” path, Braintrust if I want eval and observability fused, Weave if I have W&B credits to burn and need MCP auto-logging.
Existing users on Helicone shouldn’t panic — maintenance mode means bug fixes, not turn-off — but new architecture decisions shouldn’t bet on it.
What you actually need to instrument
A production agent has roughly seven categories of events that matter. Instrument all of them, even if your tooling lights only a subset of them up.
1. The user request. Span name gen_ai.invoke_agent. Attributes: agent ID, session ID, user ID (hashed), input message redacted to remove PII.
2. The plan. When the agent forms or revises a plan, log it as an explicit span. If you’re using the deep agents pattern, the planner’s output is the most diagnostic single piece of information in the whole trace.
3. Every LLM call. gen_ai.client span per call. Attributes: model, input tokens, output tokens, cache hit rate, latency, cost. This is where 80% of cost analysis comes from.
4. Every tool call. gen_ai.execute_tool span per call. Attributes: tool name, input args (redacted), output size, latency, success/failure. The trace should show tool calls as children of the LLM call that triggered them.
5. Sub-agent dispatches. A nested gen_ai.invoke_agent span. The parent-child relationship in the trace is how you distinguish “the Lead called a sub-agent” from “the Lead called itself again.”
6. State changes. When the agent writes to its workspace or shared state, log a span. This is critical for long-running agents — when something goes wrong four hours in, the state change that broke it is the part you need to find fast.
7. The final output and outcome. Whether the user accepted, rejected, retried, or quit. This is the signal that ties traces to user satisfaction, which ties to A/B-able outcomes.
Most teams instrument 3 and 4 well, instrument 2 partially, and ignore the rest. The result is observability that catches errors but not regressions and surfaces costs but not bottlenecks.
The replay primitive
OTel traces are the input to the second important thing in this space: trace replay. Take a recorded trace, modify one input (a system prompt, a tool result, a sub-agent output), and re-run the agent from that point. Compare outputs.
This is the unit test of production agents. Every “I changed the prompt — does it still work?” question becomes a question you can answer mechanically against a corpus of replayed traces.
Tooling status:
- Braintrust has the strongest replay UX — pick a trace, edit any prompt or tool result, re-run.
- LangSmith has replay specifically for LangChain/LangGraph applications.
- Langfuse has trace export → fixture conversion, which lets you build replay outside the platform.
- Inspect AI has OSS replay primitives for trajectory-based eval.
Replay only works if you instrumented enough to begin with. Skimping on instrumentation means replay gives you partial answers. This is one of those infrastructure investments that pays off in proportion to how much you put in.
What goes wrong in production agents
A representative set of incidents I’ve seen this year, and what observability would have caught each one:
Cache invalidation cascade. A tiny config change moved the agent’s session timestamp from “end of system prompt” to “start of system prompt” (where it had been before a refactor). Prompt cache hit rate dropped from 70% to 0%. Cost tripled overnight. Cost-per-task dashboards caught this in 6 hours. Trace inspection found the cause in another 20 minutes.
Tool selection regression. A new MCP server was added with three tools that overlapped semantically with existing tools. Agent started picking the wrong tool 14% of the time. Trajectory eval caught the regression; tool-frequency dashboards showed which tools were involved. Without those, this would have been “users complaining the agent feels worse” for weeks.
Sub-agent stalemate. A specific sub-agent started timing out on a specific input pattern. The retry loop kept invoking it, and the parent agent’s context filled with retry traces until it gave up. Per-tool latency p99 alerts caught this within minutes.
Cost drift on long sessions. A change made long sessions (over 50 turns) burn through context faster. Average cost stayed flat; p95 cost on long sessions doubled. Quantile-based cost monitoring is the only thing that catches this; average dashboards smooth it away.
Silent quality regression. A model upgrade improved the agent’s score on a specific eval but degraded it on a different one. Both evals existed; only one was wired to alerts. The team didn’t catch the regression for two weeks.
Most of these failures are not detectable from the agent’s outputs alone. They’re detectable from the trace structure, the cost distributions, and the per-step latency. Observability is the prerequisite for catching them.
What ClickHouse-Langfuse means specifically
The acquisition matters for the architecture choices teams make. Langfuse on ClickHouse means trace storage that’s a real columnar analytics database — not a managed PostgreSQL. The queries that used to take 30 seconds against a million-trace dataset run in under a second. That changes what you can do with traces from “investigate specific incidents” to “ad-hoc analytics across all your agent traffic.”
Practical implications:
- Cost analysis by any cut (per-user, per-tool, per-session-length) becomes cheap.
- Regression detection over time becomes feasible at high cardinality.
- The trace store stops being a write-once log and becomes a queryable dataset.
The dynamic is similar to what Datadog did for application monitoring — once the underlying analytics database is fast enough, observability becomes proactive instead of reactive. Langfuse on ClickHouse is the agent version of that.
What to do this quarter
If you’re shipping agents:
- Instrument to OTel GenAI conventions, not to a vendor SDK. The spec is experimental but the major vendors are committed. Instrumenting against the spec means you can switch vendors without re-instrumenting.
- Wire up trace export from day one. Every production agent should have its traces queryable. Pick Langfuse, Phoenix, or Braintrust based on the rest of your stack and start.
- Build dashboards for cost percentiles, not just averages. P95 and P99 cost-per-task is where the bad behavior hides. Averages mask it.
- Set up trace replay as part of your eval pipeline. Every interesting trace should become a replayable fixture. The replay corpus grows over time and becomes your regression suite.
- Audit your PII handling against
gen_ai.prompt.redact. The OTel conventions make this explicit. Trace stores that contain PII are a much bigger problem than people give them credit for.
The observability layer for agents is now mature. The standards exist. The vendors are real. The patterns are documented. There’s no excuse for shipping unobservable agents in May 2026; doing so is choosing to be confused about your own system. The teams that take the standardization seriously now will have an enormous advantage over the teams that don’t, because what you can measure determines what you can improve, and that compounds harder in agent work than it does in any system I’ve seen before.