Cost and Latency Engineering for Agent Systems
The two metrics that matter most after correctness are dollars per task and p95 latency. They tend to move together: the same patterns that bring cost down — caching, parallelism, right-sized models — also bring latency down. The patterns that don’t share that property (longer prompts to improve quality, more retrievals to ground answers) need to be deliberate, measured, and gated.
This post is the 2026 cost-and-latency engineering playbook. The levers, the failure modes, and the dashboards that catch waste before it ships.
Where the money goes
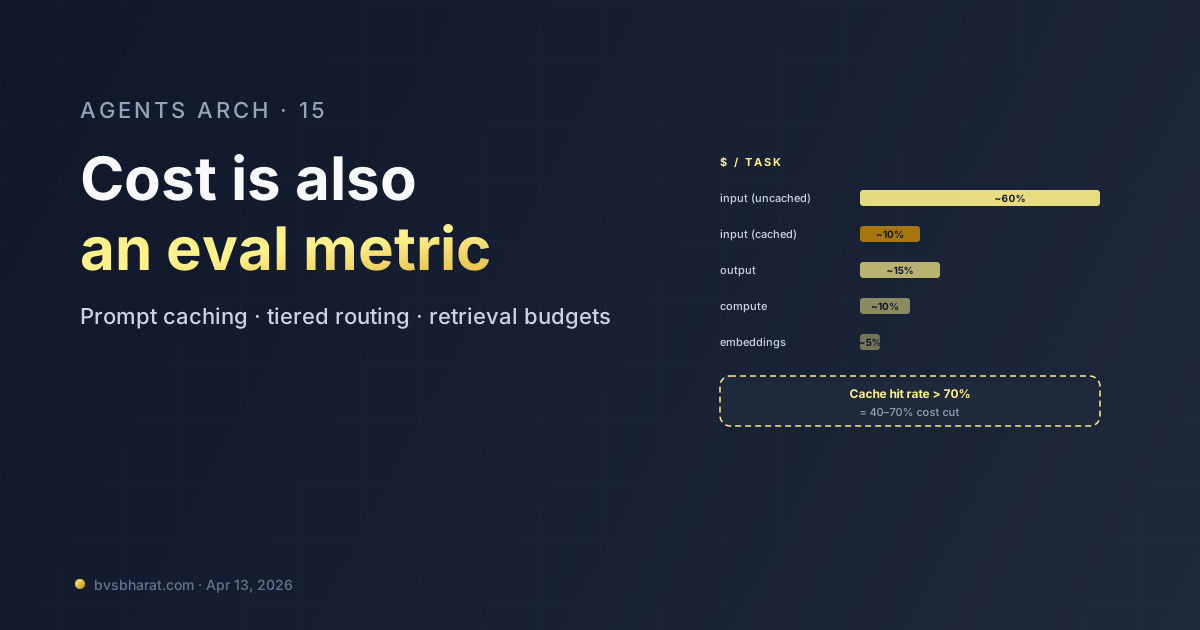
For a typical production agent in 2026, cost breaks down roughly:
| Component | Share | Why |
|---|---|---|
| LLM tokens (in) | 50–70% | Long contexts, multiple turns |
| LLM tokens (out) | 10–20% | Output is usually much shorter than input |
| Embeddings | 1–5% | Cheap, plus retrieval indexes are amortized |
| Compute / hosting | 5–15% | Containers, autoscale, managed runtime fees |
| Tool downstream costs | varies | If your tools call other paid APIs |
The dominant line item is almost always input tokens — the agent reads its history, the retrieved snippets, the tool results, the system prompt, every loop iteration. Cutting input tokens is the single most leveraged optimization.
Prompt caching: the easiest 50% off
In 2026, every major provider supports prompt caching: the static prefix of your prompt (system instructions, tool definitions, large reference docs) is cached on the provider side, and subsequent calls that reuse the prefix are billed at a steep discount (typically 5–10× cheaper for cached tokens).
Anthropic’s cache control example:
response = client.messages.create(
    model="claude-opus-4-7",
    system=[
        {"type": "text", "text": SYSTEM_PROMPT,
         "cache_control": {"type": "ephemeral"}},
        {"type": "text", "text": TOOL_DEFINITIONS_BLOB,
         "cache_control": {"type": "ephemeral"}},
    ],
    messages=conversation,
)
What to cache:
- The system prompt. Almost always identical across turns.
- Tool schemas. Tens of KB of stable text — high cache value.
- Large reference documents that the agent re-reads across turns (legal language, runbook excerpts).
- The first N messages of a conversation for long sessions.
What not to cache:
- Per-turn user input and retrieved snippets — they change every call; caching adds overhead.
- Outputs from previous turns when they vary substantially.
Caches have TTLs (5 minutes on Anthropic ephemeral). For agents that run frequently, this is free. For agents that run rarely, the cache misses; the math is still favorable when reuse rate is >50%.
The single most common deploy-time bug I see in 2026 is prompt caching configured but not actually hitting. The reason: a dynamic value sneaks into the cached prefix (timestamp, request ID, formatted “today’s date”). Audit your prefix; make sure it’s byte-identical across calls. Track cache hit rate in your observability stack as a first-class metric.
Tiered model routing
The cheapest call is the one made on a small model. Not every step needs the frontier:
- Classification, routing, parsing: Haiku, GPT-mini, Gemini Flash. 10–30× cheaper, plenty smart.
- Reasoning, multi-step planning, agentic loops: Opus, GPT-Pro, Gemini Pro.
- Edge cases the small model gets wrong: Detect and escalate.
The pattern:
async def smart_classify(text: str) -> dict:
    quick = await haiku.ainvoke(CLASSIFY_PROMPT + text)
    parsed = parse(quick.content)
    if parsed.confidence < 0.8:
        return parse((await opus.ainvoke(CLASSIFY_PROMPT + text)).content)
    return parsed
A naive “always Opus” implementation can be 5–10× more expensive than a routed one at the same quality. Calibrate the escalation threshold against your eval set; don’t guess.
Parallel tool calls
When the agent needs to call several tools and their results are independent, call them in parallel. Frameworks support this natively in 2026:
# LangGraph fan-out
def fan_out(state):
    return [Send("call_tool", {"call": c}) for c in state["pending_tool_calls"]]
Sequential tool calls add up. Three 400ms calls in series cost 1200ms; in parallel, 400ms. For agents with multi-tool plans, this is the single most effective latency win.
The catch is that some “independent” tools have hidden coupling — same database row, same rate-limited API. Test under concurrency; add explicit locking where needed.
Retrieval budgets
Retrieval is cheap individually but adds up when the agent gets aggressive. Three caps:
- Per-task retrieval budget — N retrievals max. The model should summarize accumulated context before asking for more.
- Per-retrieval token budget — concat top-k snippets up to T tokens, then stop. Don’t blindly pack all hits.
- Reranker top-k — retrieve 30, rerank to 8. The 8 are what go into context.
Tracking retrievals-per-task as a metric catches the failure mode where the agent retrieves on every step “just in case.”
Context budgets
For long-running agents, the conversation context grows. Without management, you burn cache (long prefix changes), latency (more tokens per call), and cost. Three context-management strategies:
- Truncation. Keep the last N messages. Simple, lossy, fine for short tasks.
- Summarization. When context exceeds a threshold, summarize older messages into one synthesized turn. Higher quality, costs one LLM call per summarize.
- Selective retrieval. Store full history in a memory store; retrieve only the parts the current step needs. Best quality, most complex.
Most production agents use a hybrid: truncate to a fixed window, and when key facts get dropped, the agent has retrieval-as-tool available to fetch them back.
Cost dashboards
The four dashboards that pay rent:
- Cost per task — daily aggregate, broken down by agent. The leading indicator of cost regression.
- Token mix — input vs. output vs. cached. If “input non-cached” creeps up, your cache hit rate dropped; investigate.
- Calls per task by model — shows tier routing. If a small-model agent’s Opus call count spikes, the escalation threshold may have drifted.
- p50 / p95 / p99 latency by agent and by tool — catches the slow tool that’s dragging the experience down.
Set alerts on the change, not the absolute value. “Cost per task up 30% week-over-week” is actionable; “cost per task is $0.08” is just a number.
A real cost-cut sequence
The pattern that worked across multiple agent deployments I’ve seen in 2026:
- Turn on tracing with cost attribution per span. Discover where the money actually goes (usually surprising).
- Audit the cache prefix. Make it byte-stable. Verify cache hit rate >70%.
- Tier the model. Route classification/routing/short tasks to a smaller model with quality gates.
- Parallelize independent tool calls.
- Cap retrievals per task. Reranker filters retrieve-30 to top-8.
- Trim the system prompt. Move static reference material into a cached tool definition or a retrievable doc.
- Re-run evals. Confirm quality didn’t drop; if it did, back off the change that caused it.
The sequence is roughly in order of effort-to-payoff. Caching and tiered routing alone typically cut cost 40–70% without quality loss; you’d be surprised how many teams skip them.
Latency-specific patterns
A few tricks specifically for shaving p95:
- Streaming output. First token under one second matters more for perceived latency than total response time. Use streaming for any user-facing agent.
- Speculative tool calls. Start the most likely tool call while waiting for the LLM’s plan; cancel if the model chose differently. Risky, save for cases where one tool dominates the distribution.
- Pre-warm the LLM client. Keep the HTTP connection alive between calls; don’t reconnect for every request.
- Region locality. Run agent containers in the same cloud region as the LLM provider. Cross-region adds 50–150ms per call.
What “good” looks like
A 2026 cost-and-latency posture worth shipping:
- Prompt caching configured and verified hitting >70%.
- Tiered model routing for classification and short tasks.
- Parallel tool calls where independent.
- Retrieval budget and reranker between retriever and context.
- Streaming output for user-facing surfaces.
- Daily cost-per-task and latency-percentile dashboards with alerts.
- A monthly cost review that asks “what changed and was the change worth it.”
Next week: security — the threat model for agents, prompt injection that’s not solved, tool sandboxing, and how to keep the agent’s permissions narrow.