Agent Observability: Tracing, Metrics, and Debugging at Scale
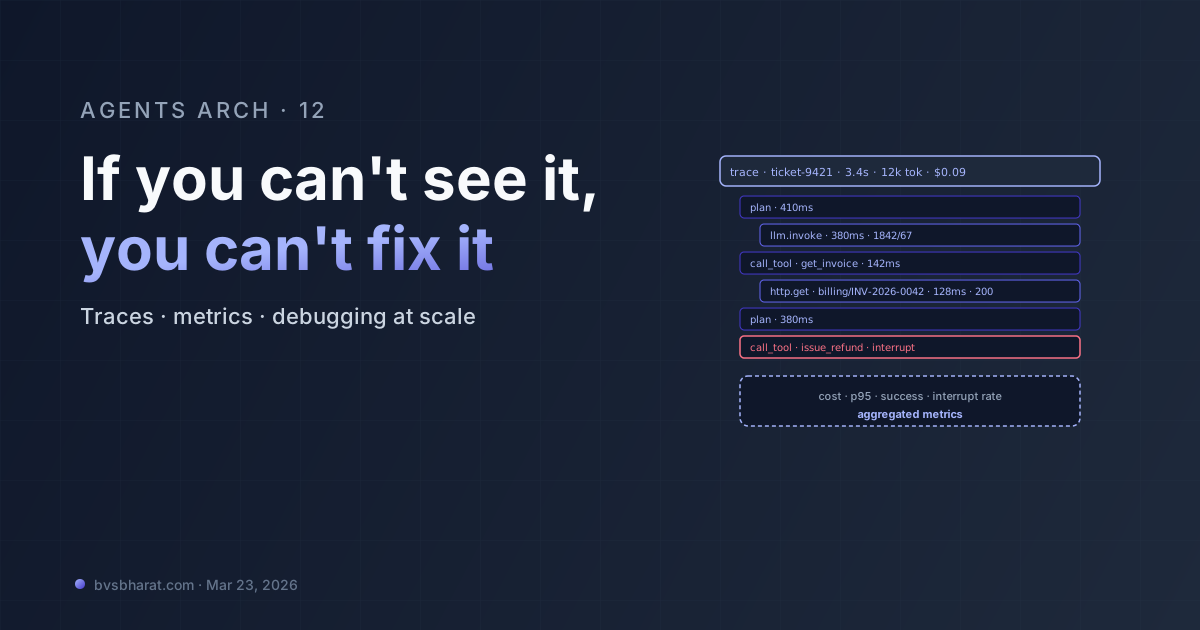
Three years into the production-agent era, the thing that distinguishes the teams shipping reliable agents from the teams firefighting weekly isn’t the model, the framework, or even the prompt. It’s whether they can see what happened. Agents are non-deterministic, stateful, multi-step systems making calls to external services. Without traces, every incident is a guess.
This post is the 2026 observability stack — what to instrument, what to measure, and the small set of dashboards that actually pay rent.
The trace is the unit of debugging
A trace is the full record of one agent run: every node executed, every LLM call, every tool call, every state mutation, with timestamps, tokens, costs, and parent-child relationships. If you have the trace, you can replay; if you don’t, you’re guessing.
That tree is the artifact. Every observability vendor’s UI is some variant of it. The interesting design choice is what you put in each span — and what schema you stick to.
The trace schema that holds up
A trace entry worth its bytes:
{
  "span_id": "sp_2c9a...",
  "trace_id": "tr_8f10...",
  "parent_id": "sp_2c99...",
  "name": "call_tool.issue_refund",
  "kind": "tool",
  "start_ts": "2026-03-23T17:42:11.420Z",
  "end_ts":   "2026-03-23T17:42:11.842Z",
  "attributes": {
    "agent.name": "billing-resolver",
    "agent.session_id": "ticket-9421",
    "agent.step": 4,
    "actor.user_id": "user_92",
    "tool.name": "issue_refund",
    "tool.args.invoice_id": "INV-2026-0042",
    "tool.args.amount_cents": 24000,
    "llm.model": null,
    "tokens.in": null,
    "tokens.out": null,
    "cost_usd": 0,
    "status": "interrupt",
    "interrupt.reason": "approval_required"
  }
}
Five things that age well:
trace_idties everything together — the LLM calls, the tool calls, the upstream HTTP request, the downstream message-bus dispatch. It should be the same ID across processes when work hops via A2A or a bus.agent.session_idis your domain key —ticket-9421, not a UUID. You’ll grep for it during incidents.agent.stepis the cursor. Combined with the session ID it uniquely identifies “where in the loop are we.” Critical for understanding step caps and divergence.- Args go in attributes — but mind the size.
tool.args.invoice_idis fine;tool.args.full_document_textwill blow your trace store. Truncate long values; store full payloads in object storage and reference by URL. statusandinterrupt.reasonmake alerts cheap. Filter onstatus=errorfor the failed-runs dashboard. Filter onstatus=interruptfor the human-approval queue.
Three tiers of observability
The pragmatic split:
Tier 1 — Framework-native tracing (LangSmith, Langfuse, AgentOps)
The framework already emits spans. Turning on LangSmith is two environment variables; Langfuse is the same. You get the trace tree, the LLM call detail, token counts, and replay — for free, no code changes. This is the floor; every agent in production should have it.
# LangSmith
export LANGSMITH_TRACING=true
export LANGSMITH_API_KEY=...
export LANGSMITH_PROJECT=agents-arch-prod

# Or Langfuse
export LANGFUSE_PUBLIC_KEY=...
export LANGFUSE_SECRET_KEY=...
export LANGFUSE_HOST=https://langfuse.acme.internal
LangSmith is the LangChain-native option, deepest integration. Langfuse is open-source-with-cloud, framework-agnostic. AgentOps focuses on multi-agent. Choose one; running multiple traces of the same run in different systems is rarely worth the friction.
Tier 2 — OpenTelemetry spans for everything else
Tool implementations call HTTP services, databases, message buses. Those calls need spans too, parented to the agent trace so you see end-to-end latency. Wire the framework’s tracing context into OpenTelemetry and emit spans from your tool code:
from opentelemetry import trace

tracer = trace.get_tracer("agent.tools")

@tool
async def get_invoice(invoice_id: str) -> dict:
    """Look up an invoice."""
    with tracer.start_as_current_span("billing.get_invoice") as span:
        span.set_attribute("invoice.id", invoice_id)
        result = await billing.fetch(invoice_id)
        span.set_attribute("billing.status_code", result.status_code)
        return result.json()
Now agent → tool → http → billing-service is one trace tree. When the agent is slow because billing is slow, you see it in one place.
Tier 3 — Metrics aggregated from traces
The third tier is the metrics that get computed by your observability backend from the raw spans. A handful are worth dashboarding:
- Tasks completed / hour, success vs. failure.
- p50 / p95 latency per agent and per tool.
- Cost per task (tokens × rate, aggregated).
- Step-count distribution — a long tail at the cap means the agent is running out the clock.
- Interrupt-and-resume rates — how often is human-in-the-loop firing.
- Tool error rates by tool — which integration is flaky this week.
These are the dashboards on-call actually reads. The trace tree is for the incident; these are the leading indicators that prevent it.
Eval traces vs. production traces
A subtle but important distinction. Two systems consume traces:
- Production observability — real-time, sampled, optimized for incident response. Often retains a few days of full detail and weeks of aggregates.
- Evaluation pipeline — sampled or full, replayed for grading. Stored longer; often joined with labels for model comparison.
Don’t try to make one system serve both shapes. Replay an eval batch into a separate workspace or project. Keep prod traces clean for actual issues; keep eval traces labeled and stable for grading.
Sampling and cost
At scale, storing every trace is wasteful. The pattern that works:
- 100% of failed runs. Errors are rare and high-information.
- 100% of human-in-the-loop interrupts. Always investigate-worthy.
- 5–10% of successful runs, deterministically sampled by hash of
session_id. Enough for aggregates; cheap. - 100% of runs flagged by the eval gate (low confidence, low faithfulness score). Catch silent quality regressions.
Configure this at the tracing client, not after-the-fact. Most observability vendors expose head-based sampling for free.
Debugging in practice
Three workflows that go faster with traces:
“The agent gave a weird answer.”
Look up the trace by session ID. Read the LLM call history — every prompt the model saw, every response. Read the tool call args and results. Compare to your memory store at the time. The bug is almost always:
- A retrieved snippet you didn’t expect to surface (RAG issue → look at the retrieval span).
- A tool that returned a wrong-shaped result (integration issue → look at the HTTP span).
- A truncated history (context budget → look at token counts).
”The agent looped until budget exceeded.”
Look at the step-count distribution dashboard; identify the agent and time window. Read a sample trace. The pattern is almost always that one tool returns “no result,” the model retries with a slightly different argument, and the loop continues until budget. Fix: better tool error responses, or a step-level pattern detector that breaks the loop.
”The agent is slower this week.”
Look at p95 latency per tool. The culprit is usually one downstream service that’s degraded. Add a per-tool budget; treat slow tools the same as failed tools so the agent doesn’t hang.
What “good” looks like
Minimum bar for production observability in 2026:
- Framework-native tracing turned on (LangSmith or Langfuse).
- OpenTelemetry context propagated into your tool implementations.
- Trace IDs surfaced in error reports and user-facing support flows.
- Dashboards for success rate, p95 latency, cost-per-task, step-count distribution, interrupt rate.
- Trace retention policy explicit: keep failures forever, sample successes.
- A runbook that says “given session ID X, find the trace, do these three checks.”
Above that, eval pipelines, replay tooling, and trace-based regression gates — covered next week.